Are you fascinated by the potential of integrating technology with nature to revitalize urban living?
Blog
Back to blogMonitoring the quality of urban green space, from space

Yet, local governments lack proper tools to efficiently map and assess the amount, condition, and quality of parks, gardens, and other urban green space. As a result, it is difficult to formulate and execute policy goals with precision. Green City Watch aims to unlock valuable insights about the quality of urban green space by combining machine learning and image processing algorithms with DigitalGlobe’s high-resolution satellite imagery. In short: we’re monitoring the quality of urban green space, from space.

Although urban green space offers social, ecological, and even economic benefits, they rarely get priority in the urban master plan. Especially as cities grow, it is imperative green space grows in parallel. The tension between grey (read: pavement, buildings, infrastructure) and green is as old as the world’s first cities. Green City Watch believes an assessment of urban green space based purely on quantity is insufficient. Despite a clear call for greener cities (UN Sustainable Development Goals, UN-Habitat’s New Urban Agenda), our initial research revealed a compelling lack of decision support and monitoring tools to measure existing urban greenery. Interviews with Dutch city officials also showed local government seldom has access to the data necessary to improve the state of their parks. Currently, quality assessments use surveys, checklists, or in-situ observations. This data is quickly outdated, laborious to collect, and lacks a proper, holistic understanding of what quality truly means. Green City Watch, once fully developed, could help distil a city’s “park agenda” as effectively as possible, saving cash-strapped municipalities time and money, and improving quality of life for all urban citizens.
Geospatial big data for urban green space quality assessments
A comprehensive literature review was conducted to explore the use of geospatial big data to assist in quality assessments of urban green space. The results include a holistic indicator framework called the Urban Green Classification Index. The index, amongst other variables, includes the measuring of water bodies, composition of greenery, riparian (read: riverbank) vegetation, and the quantification and classification of recreational facilities. The indicators are scored from 1 (poor-quality) to 5 (high-quality) with respect to a specific green space. Access to DigitalGlobe’s GBDX( Geospatial Big Data platform) and 100 PB imagery library enabled this process in an innovative way. With access to the data and OpenStreetMap, Green City Watch was able to view, classify and measure previously “invisible” objects, such playgrounds, benches, and riparian vegetation, which are essential for quality assessments.
Here, quality is meant in the broadest sense of the word and covers social, ecological, and economic notions of quality. Social quality, for example, includes indicators such as the presence of various amenities and recreational facilities (e.g. benches, monuments, water points, playgrounds, and restaurants). But we also consider the ratio between grey (paved) versus green (unpaved) surfaces and assess the greenness in winter, which has the potential to alleviate the seasonal affective disorder. Ecological quality maps the park’s water bodies, plant canopies, vegetation zones, and impermeable surfaces to assess stormwater retention, water infiltration, and temperature regulation. Economic quality provides an estimation of the value provided by a park’s ecosystem services, one more reason for cities to improve the quality of their urban green space.
Some cities may face social challenges over ecological issues and can choose to adjust the weighting of the aforementioned indicators. To test our pilot tool, we selected four preliminary case studies: Amsterdam, Rio de Janeiro, Tokyo, and Houston, and only considered parks greater than two hectares. The chosen cities differ greatly with respect to political, social, and environmental pressures and are subject to such pressures across both hemispheres. Our aim is to validate the methodology for assessing the quality of green space, mainly to ensure it can be utilized and upscaled across varying landscapes.
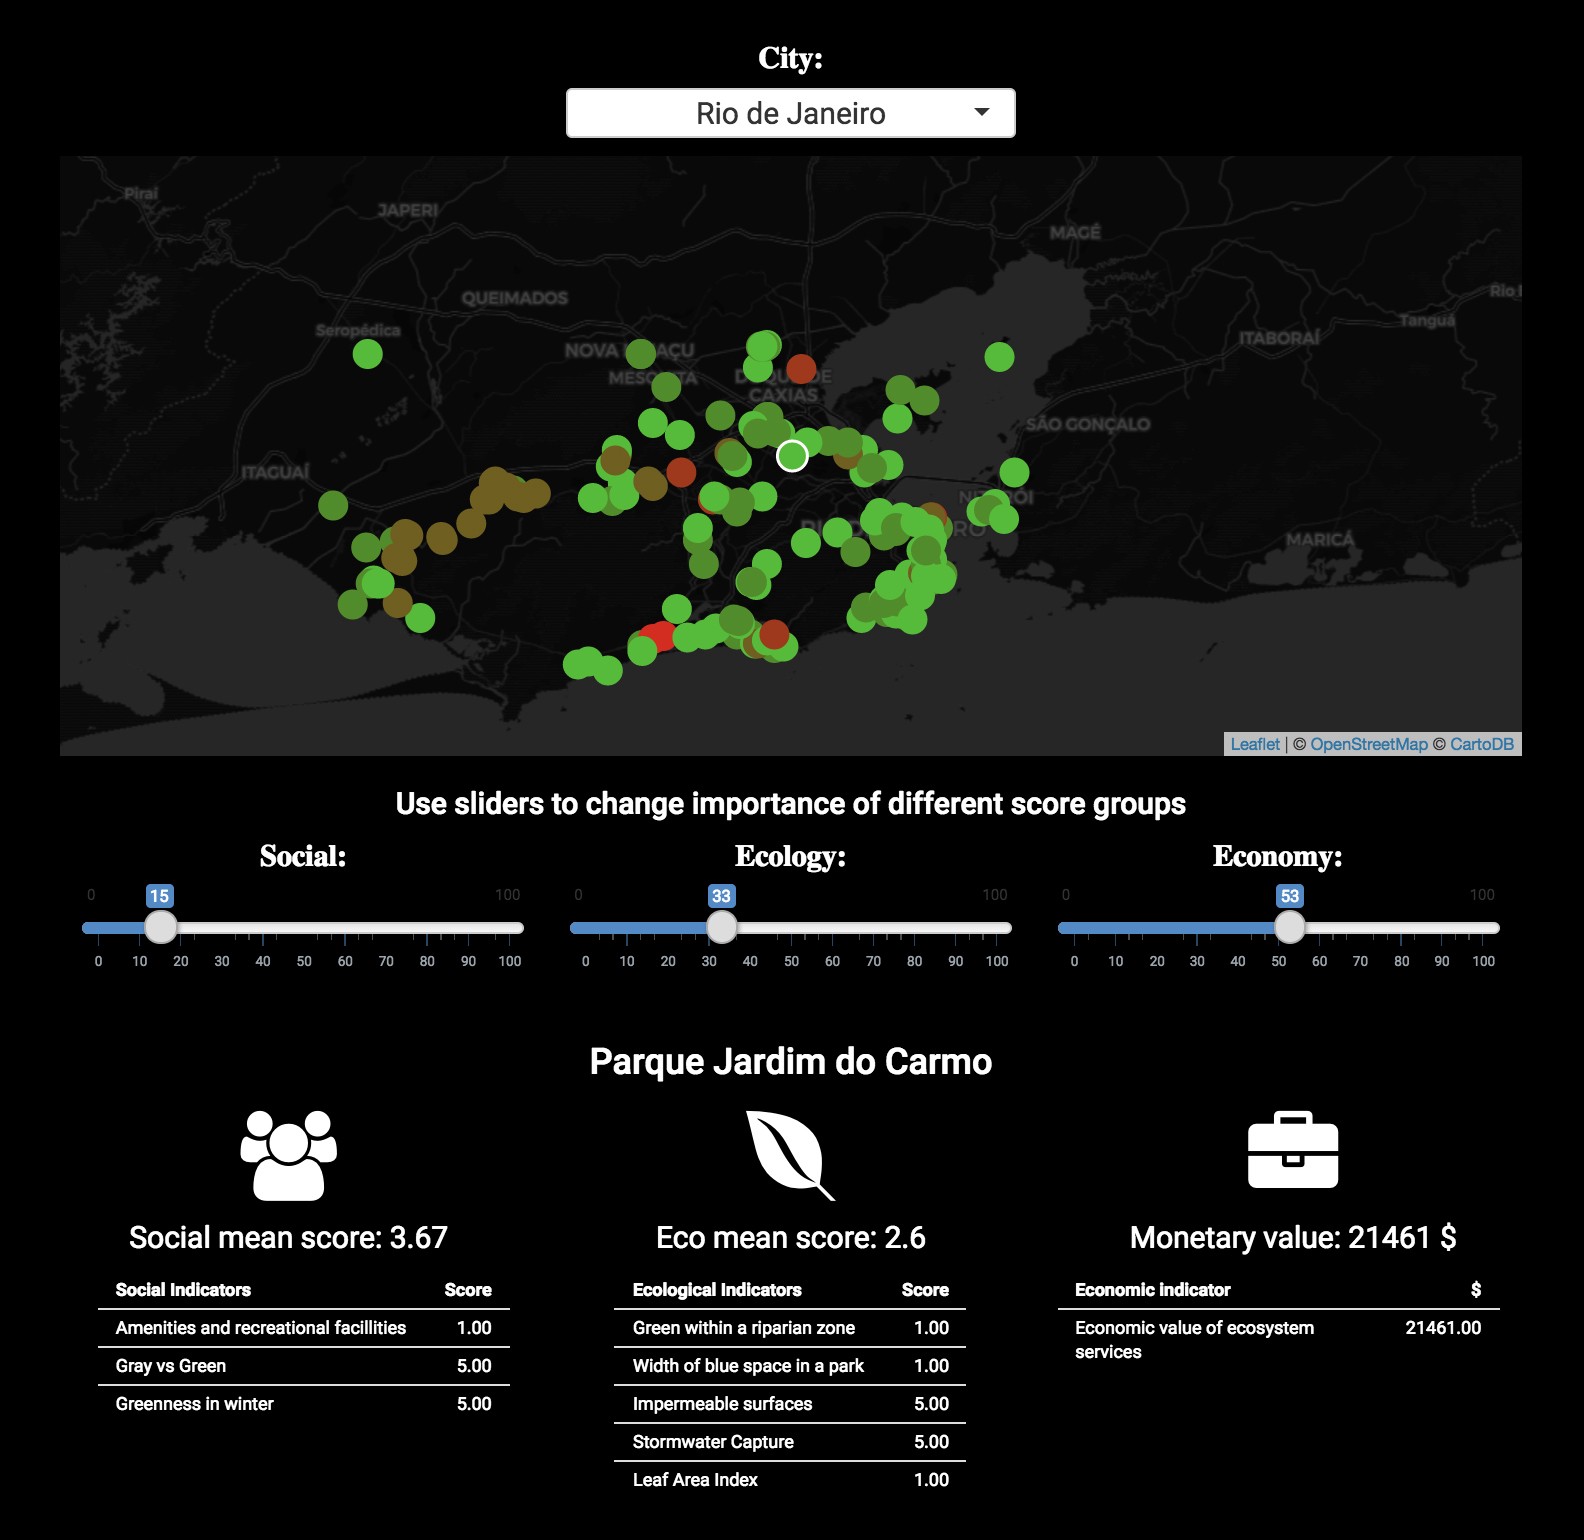
In the figure showing the dashboard below, Rio de Janeiro has been selected. After adjusting the sliders, green, red, and orange circles will appear on the map, representing Rio’s urban green spaces. The green circles indicate a high-scoring park, the orange show medium-scoring parks, and the red pinpoints parks that require quality improvements. Once a circle is clicked, the scorecard for that specific park will be displayed. Anyone can test our tool on our website.
Bridging the gap between artificial and crowd intelligence
This dashboard makes insights actionable, but we want the back-end to be accessible as well. That is why, for the GBDX for Sustainability Challenge, we’ve delivered a streamlined, open-source python tool package alongside a flat data file so that technical, as well as non-technical audiences, can use our results, replicate our methodology, and also tailor it to specific needs and extend or improve it. Notebook versions of our project are published on the GBDX platform for easy access to our toolbox. For more advanced users, our GitHub repository allows access to the source code of our tools and our dashboard.
Ultimately, Green City Watch will be expanded to include a citizen-science component where qualitative observations (e.g. notes, photos) can be uploaded to alert local governments in real-time. With rapid urbanization underway, the ecological quality within cities is at a tipping point. Either cities will face vulnerability to climate change and resource shortages, or prioritize nature’s defences and boost urban resilience. Whatever happens, Green City Watch is here to empower local communities and effectively improve the quality of their urban green space.
This article originally appeared on Maxar’s website on May 3, 2018, and later in Geospatial World on May 14, 2018.


